
NPV Tab
The NPV tab is only available for Economic results. It provides graphs of all money array results over a 0% to 100% discount rate progression. By selecting cash flow results you can study the sensitivity of the resulting NPV to variations in discount rate.
PetroVR uses the data from the selected result to compute the NPV value for each discount rate according to standard NPV calculations, and plot them on the graph.
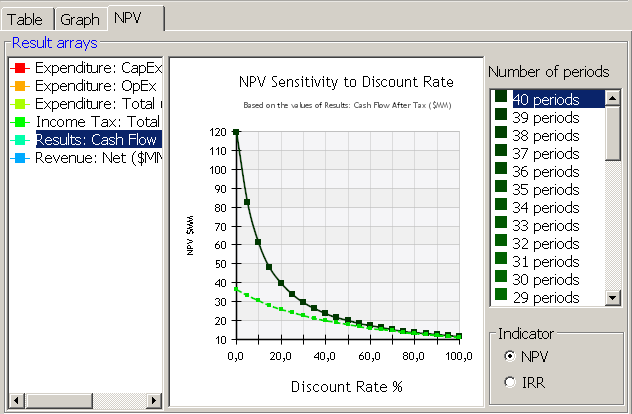
- Number of periods: Use this list to analyze NPV sensitivity at different stages of the project, thus simulating interruption of the project prior to its theoretical completion.
- Indicator: Switch to IRR to graph IRR progression over the project periods.
IRR tends to stabilize after a given number of periods. This can be used to estimate the number of periods that are worth simulating in order to get a good enough IRR ─ that is, the duration from which no improvement in the IRR is obtained.